ccc
Developers And Agents
Ways to see and review what changed, beyond the command line:
- Visualisation: the change visualiser, and the player that replays agent work inside it
- IDEs: the VS Code extension, and wiring agents to ccc
- Replays: keeping the story of a branch beside it, privately
Visualisation
ccc run --vis serves a 2D map of the project at http://127.0.0.1:6767/vis and opens it in your browser. The VS Code extension shows the same page in its panel. It follows the C4 model from the whole system down to the code, then goes one level further: the logic of a single function, drawn as a node graph.
ccc run --vis
Levels
| Level | Boxes | Arrows |
|---|---|---|
| Context | the system; peer repositories from externals in .ccc/map.json; endpoints nothing in the map answers |
cross-calls, by transport |
| Containers | services from .ccc/map.json, or top-level directories without one |
resolved and declared calls between services |
| Components | the files in one container; other containers it touches sit outside the boundary | file-to-file calls |
| Code | the functions in one file, each with an input pin and one output pin per function it calls | resolved calls; functions in other files as stand-ins |
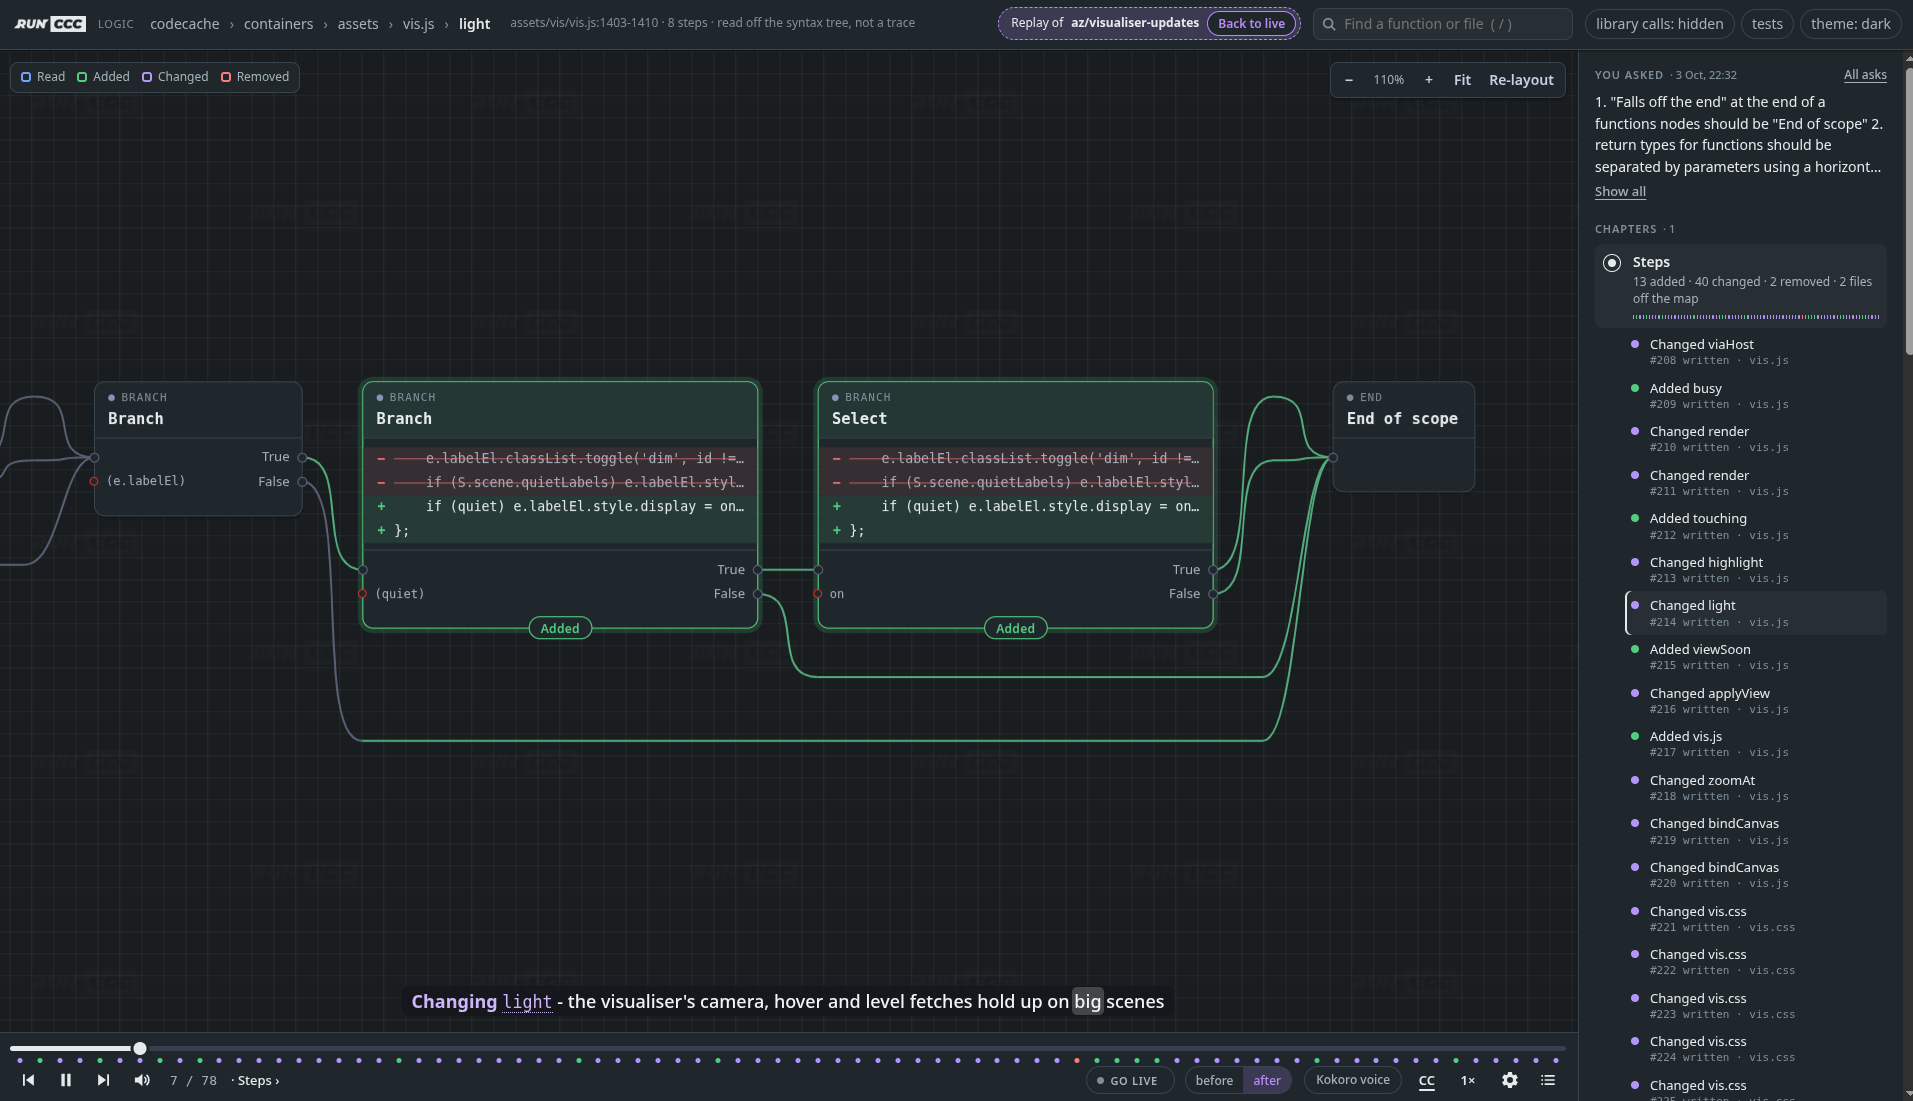
| Logic | one function: entry, calls, branches, switch/match/try arms, loops, closures, returns and throws | execution order |
Every level is built from the same map the MCP tools read, so every supported language is drawn the same way. Like the rest of ccc, it reads syntax, not behaviour. An arrow is a call the resolver found evidence for, and a branch is a node in the syntax tree, not a path anything was seen to take. Calls that reach nothing in the project (the standard library, a dependency) are folded into grey pills; the toolbar shows them in full or hides them.
Getting around
| Key or action | What it does |
|---|---|
Double-click or Enter |
Drill down a level. |
Escape |
Go back up a level. |
| Breadcrumb | Jump to any level. |
/ |
Search for functions and files, and open them directly. |
| Drag | Rearrange boxes. Positions are remembered per view. |
Every view has its own URL, so the browser’s back button works and views can be bookmarked. The page reloads by itself when the map changes. A view of 50 or more components or functions is laid out a group at a time.
The player
A player along the foot of the page replays what agents did through ccc. Each ask plays as a story: the agent’s plan, every step it took and how it ended. The story is told in subtitles and read aloud, and the bar is cut into chapters, listed in a rail beside the canvas.
- Chapters. One per part of the work, named after what the agent said its steps were for: the intent on its edit calls, the reason on its reads. Pick a chapter or a step to go there, or All asks to play another ask.
- The lines a step wrote appear inside the nodes they fall in: additions in green, removals struck through. A change to a file the map doesn’t draw, such as a stylesheet or a README, shows on a card over the canvas.
- One definition at a time. An edit is split into the definitions it touches: imports first, then what it adds, then what it changes, then what it removes. A replay builds the change up in the order the agent staged it.
- Reads too. What an agent reads appears as an inspect, so you can see what it looked at before it wrote anything. That covers ccc’s
find,references,fileanddependenciesanswers, and the agent’s own reads from its transcript: Claude Code’sRead, or acat,sed -norgrepin its shell, a subagent’s included. - Live. While Live is lit, each change is shown as it lands. Stepping, scrubbing or picking a chapter stops on that step.
- At your pace. 1× keeps the original time between steps. 1.5× and 2× speed it up, ½× and ¼× slow it down, and the voice reads at the same speed.
- Granular changes. Turn this on in the player’s settings. While a step is on show, everything it didn’t touch fades back, and a big scene draws only what is wired to the step, laid out to fit the screen. Click the canvas to bring the rest back.
| Key | What it does |
|---|---|
Space |
Play or pause. |
← / → |
Step back or forward. |
L |
Turn Live on or off. |
c |
Turn subtitles off or on. |
m |
Turn the voice off or on. |
The voice is a local model, downloaded once per machine (see ccc voice). Every ccc server on a project shares its steps through .ccc/timeline.jsonl, which is kept out of git. So the visualiser shows an agent’s work whichever server the agent talks to.
The data behind it
The page is built from plain JSON, which is served with or without --vis:
curl -s localhost:6767/vis.json                              # context, containers, components
curl -s 'localhost:6767/vis/code?file=src/scan.rs'           # one file's functions and calls
curl -s 'localhost:6767/vis/flow?file=src/scan.rs&line=76'   # one function's logic
IDEs
VS Code
extensions/vscode puts ccc’s analysis on the code it applies to. It runs its own ccc analyser in the background for each workspace folder and reads it over loopback HTTP, so nothing leaves your machine and nothing needs configuring to start. When no ccc binary is found, it downloads the release for your platform.
Install. cargo build --release packages the extension next to the binary:
cargo build --release                             # -> dist/ccc-codecache.vsix
code --install-extension dist/ccc-codecache.vsix
To build only the extension: cd extensions/vscode && npm install && npm run package. It isn’t published to the Marketplace.
Hints. Each changed function carries a clickable CodeLens:
| Hint | What it means |
|---|---|
✓ 3 tests |
The function changed and tests cover it. Opens them, nearest call hop first. |
✗ no smoke test |
Nothing covers the change. The kind of test worth writing is named: smoke, integration, contract, perf or load. |
→ billing |
This line calls into another service. Opens the callee. |
← gateway |
Another service calls this function. Opens the callers. |
▲ 37 callers |
A hot path: among the most called, most complex or widest fan-out. |
↻ cycle of 3 |
The function is in a call cycle. |
↑ calls billing in acme/billing |
The call leaves the repository. Opens the handler when that peer is checked out locally. |
Test, coverage and service-boundary hints are based on the diff. A file identical to the base ref has none, by design. Hot paths and cycles come from the call graph alone, so they show on any file. Every function also shows its complexity as a circled number from 1 to 10 between its name and signature, coloured from grey to red as it climbs.
The panel. Click the Code Change Capture mark in the activity bar. It has three views:
- Triggers: the tests your changes make necessary (Run these), the changed functions nothing covers (No test covers), and the command that runs exactly that set (Commands, click to run it in a terminal). The badge is the number of tests worth running before you push.
- Complexity: every measured function grouped by band, worst first, filterable by name, parameter count and band.
- Visualiser: the visualiser above, with the timeline of edit steps. While an agent edits through ccc, it flies to each change as it lands. A staged change is drawn as Proposed before anything is written, next to the intent the agent gave for it.
Everything runs against the working tree, so uncommitted and untracked files count. Hints reflect the last saved state; they fade while a file has unsaved edits and refresh on save.
The extension’s own page, extensions/vscode/README.md, lists its commands.
Settings:
| Group | Settings |
|---|---|
| Analyser | ccc.binaryPath (your own ccc), ccc.autoInstall (false stops the download), ccc.server.autoStart, ccc.server.address, ccc.server.port (0 picks a free port; a fixed one collides across windows), ccc.server.watchIntervalSec (0 lets the extension drive rescans), ccc.server.startupTimeoutMs, ccc.server.extraArgs (extra ccc run options, for example --auto), ccc.server.ignoreSkip (the same as --ignore-skip) |
| Hints | ccc.enable, ccc.baseRef, ccc.hints.codeLens, a toggle per kind (ccc.hints.testTriggers, untested, outbound, inbound, hotPaths), ccc.hints.includeTestFiles, ccc.hints.crossServiceMode (auto, always, off), ccc.hints.minEvidence (evidence, any), ccc.untested.showUncoveredTargets, ccc.untested.minPriority |
| Complexity | ccc.complexity.enabled, ccc.complexity.minScore |
| Decorations | ccc.decorations.style (badge+gutter, badge, gutter), badgeMaxLength, dimWhenDirty, overviewRuler |
| Refresh | ccc.refresh.onSave, onWindowFocus, intervalSec (off by default), debounceMs |
| Search | ccc.search.mode (none, allow, block), ccc.search.urls and ccc.search.endpoints: what the search tool may reach, for example only your company’s docs and portals |
| Logging | ccc.trace (off, messages, verbose) |
ccc.hints.codeLens: false with ccc.decorations.style: badge+gutter shows end-of-line badges instead of lenses.
How the hints are worked out. The analysis is static. Knowing what it did and didn’t establish is the difference between a useful hint and a misleading one.
- Coverage comes from the call graph, unless a recorded run says more. A test is linked to a change because the graph connects them. A test that reaches code through dynamic dispatch, a table of function pointers or a framework is invisible to the graph, so without records
✗ no testmeans “nothing reaches it”, not “nothing runs it”. Observed coverage records close that gap: a function a recorded fixture ran counts as tested, and its hover says the run saw it. - A call is tied to a definition only with evidence: the receiver’s declared type, the same file, the same package, an import, or a qualifier naming the defining file. Where that evidence fits more than one definition, nothing is claimed, and a Rust test can never mark a TypeScript function covered. In untyped languages, a bare call to a name defined exactly once still counts, and its hover says it was matched on the name alone.
ccc.hints.minEvidence: evidence(the default) hides those. - Cross-service hints depend on
.ccc/map.json. With aservicesblock, a hint sits on the exact call line. Without one, ccc groups by top-level directory and labels the result a module. In a flat project,ccc.hints.crossServiceMode: autohides these hints rather than calling every import a service call. A declared edge with no call site is normal: that’s what an HTTP, RPC or queue dependency looks like to static analysis. - “Hot” means central to the call graph, not measured. Only the top 25 of each ranking are marked, so a function without a flame isn’t necessarily cold.
- Lists are capped: 25 covering tests, 60 ranked targets, 60 call sites and 100 symbols per edge, and 8 names per triggered test. Hovers say when a list is at its cap.
Troubleshooting. The status bar entry says what’s wrong:
- ccc with an error icon: the analyser didn’t start. Run ccc: Show Log.
- ccc with a warning icon: git couldn’t resolve a base ref, on a shallow clone or a repository with none of the default branches. Set one with ccc: Select Git Base Ref….
- No hints in one file: either nothing in it changed against the base ref, or it isn’t in the map (ignored by git, or in a language ccc doesn’t parse). The status bar tooltip says which. To widen the diff, point
ccc.baseRefat an older ref or turn onccc.untested.showUncoveredTargets. - Everything looks like a cross-service call: the project has no
.ccc/map.json, so add aservicesblock. - “could not find the ccc binary”: the download failed, or
ccc.autoInstallis off. Retry Install tries again; otherwise buildcccand setccc.binaryPath. - The analyser keeps restarting: it backs off and gives up after five failures in five minutes. ccc: Show Log has the last 20 lines of each crash.
Working on the extension:
cd extensions/vscode
npm install
npm run watch     # esbuild in watch mode, then F5 for an Extension Development Host
npm run check     # type-check
npm run package   # -> ../../dist/ccc-codecache.vsix
src/model.ts turns an /insights.json payload into hints without importing vscode, so it can be tested against a saved payload without an extension host.
Agents
The extension’s analyser runs on a free port so windows never clash. Each time it starts, it writes that port to .mcp.json (Claude Code) and .vscode/mcp.json (Copilot), so both find the server without being told. Both files are generated; keep them out of git. An agent session that was open when the analyser restarted still has the old port, so reload it.
Without the extension, register a ccc run yourself:
claude mcp add --transport http ccc http://127.0.0.1:6767/mcp
copilot mcp add --transport http ccc http://127.0.0.1:6767/mcp
Then add this block to an AGENTS.md at the repository root. Claude Code, Copilot, Cursor and other agents that read AGENTS.md pick it up at the start of every session:
# AGENTS.md

This repo has a Code Change Capture (ccc) map, served over MCP. Use it as the entry point for everything you do here.

- no bash, grep or sed usage for exploring the project
- Every interaction: use `ccc` tool calls to gather information about the source of this project.
- All thinking, navigation, and questions about the codebase go through the MCP server tools: (index, find, references, dependencies, vulnerabilities, deps, security, file, notes, changes, prompts, pr_summary, test_triggers, test_targets, lints, hot, services, search, violations, refresh)
- The web, internal docs and portals included, goes through `search`: `query` to search the configured endpoints, `url` to fetch one https page. Never WebFetch, WebSearch, another MCP server's fetch or browser tool, or `curl`/`wget` - ccc can't track those, and `violations` reports each one. If `search` refuses a URL, leave it unreached.
- ccc is the only writer: make every change through its edit tools - `edit_rename`, `edit_replace`, `edit_delete`, `edit_insert`, `edit_text` or `edit_move`, then `edit_apply` - never your own Edit/Write tools, `sed -i`, `mv` or shell redirection. `edit_discard` drops a staged changeset and `edit_revert` undoes an applied one.
- `edit_apply` rescans the map before it answers; call `refresh` only after a change made outside ccc.
With that in place, the agent’s answers come from ccc’s map, and every change goes back through ccc. That keeps each change inside the project, previewed before it is written, and revertible.
Replays
ccc can keep the story of a branch as a replay beside it, under refs/ccc/replay/<branch>: each ask, what the agent read and changed, and its narration. A reviewer can then play back how a change was made in the visualiser. A replay never lives in a branch’s files, so a merge can’t carry one into the default branch.
Turning recording on
Recording is opt-in, per repository: nothing is recorded or pushed until someone turns it on. Neither ccc run nor the VS Code extension asks, records or pushes anything by itself. Turn it on with ccc replay enable, or ccc: Session Recording… in VS Code. The answer is kept in git config ccc.replay, so both agree.
ccc replay enable     # record this repository's agent sessions
ccc replay disable    # stop; replays already saved stay where they are
ccc replay status     # whether recording is on, and who can read the remote
Once recording is on, the pre-push hook saves each branch’s replay as you push it. CLI.md has every replay command and option.
Keeping them private
A replay carries your prompts and the code each step touched. On a private repository, that’s ideal: everyone who can read the code can replay how it was written. On a public one, it’s a leak. So:
-
No replay goes to a public remote unless it is encrypted to your team (below). Before pushing one, ccc checks, signed out, whether the remote answers. If it does, the replay stays on your machine. To override the default setting which disallows pushing replays to public repositories see the section at the bottom.
-
Secrets are redacted first. Before a replay is committed, anything that looks like a credential is replaced with
[redacted: …], whether it is in a prompt, the agent’s words, a diff or a file it touched. A narration line that read one out stays on your machine.
Team-encrypted replays
A team on runccc can encrypt every replay to its project’s key, so only the team can open one, wherever the repository lives, public remotes included. The project page gives the snippet for .ccc/map.json:
{ "replays": { "encrypt": { "project": "prj_some_random_key" } } }
ccc login     # sign in: approve the code in your browser
ccc whoami    # who you are, your teams, and the project this repository encrypts to
ccc logout    # revoke the token and forget it here
In VS Code there’s nothing to run. Turning recording on in a repository that encrypts its replays signs you in, opening the approval page in your browser. Team members must be in the same runccc team to view each other’s replays.
Each save fetches the project’s public key and encrypts every replay, so nothing in refs/ccc/ is readable in the clear. Where encrypt is set, a replay that can’t be encrypted isn’t saved. That happens when you’re not signed in, not on the team, or not on a paid plan, or when runccc is out of reach and no key was fetched in the last day. The push itself goes ahead, with a note explaining why the replay wasn’t saved.
A replay a teammate’s older ccc pushed in the clear is flagged by ccc replay status and the visualiser. It is encrypted, with its history started over, the next time its branch is pushed. Set service next to project, or RUNCCC_URL, to point ccc at another key service. The token and cached keys live in ~/.config/ccc/runccc/, readable only by you.
Secret warnings
The same scanner warns before a secret is committed or pushed, whether or not you record replays. It knows:
- provider token formats (GitHub, AWS, Slack, Stripe, Google, OpenAI, Anthropic and more)
- private keys and JSON Web Tokens
- passwords in URLs
- high-entropy values assigned to credential-like names
It checks every file, including .env, YAML and JSON as well as code. You’ll see the warning in several places:
ccc sastand thesecurityMCP tool report it assecret-in-changechangesandpr_summaryopen with a warning- the pre-push hook says so as you push, once
ccc replay enableorccc replay installhas installed it. It never blocks the push, andgit config ccc.secrets falseturns it off - VS Code marks the line and shows a message the first time it appears
A line meant to carry one, such as a test fixture, can say so with ccc:allow-secret. pragma: allowlist secret and gitleaks:allow are recognised too.
PROCEED WITH CAUTION - this will publish your agent conversations and/or transcriptions
DO NOT DO THIS: This makes your replays and transcriptions/conversations with the agent public. This causes an override of the default ccc behaviour (default behaviour prevents replays being pushed to public remotes). Adding the below snippet to .ccc/map.json will push replays and their transcriptions (including potentially sensitive content) to the public repo:
  // DO NOT DO THIS ON PUBLIC FACING REPOSITORIES
  { "replays": { "allow_public_remote": true } }